Introduction
If you run analytics on hundreds of millions of domain datapoints, your Elasticsearch cluster is not "just search." It is a production data plane for product teams, analysts, and sometimes entire partner ecosystems. At Domainsbot, the Pandalytics (Business Intelligence) stack sits in that world: rich mappings, long-running queries, and Kibana exports that must survive real user expectations—not demo sizes.
I worked with their team on a self-managed Elasticsearch 7.x deployment on AWS alongside a legacy Elasticsearch 2.x footprint. The work was not a single ticket. It was a pattern: stability first, then reporting throughput, with numbers captured in notes rather than a marketing slide deck.
The Challenge
Three pressures showed up at once.
Query Timeouts
The cluster had search.default_search_timeout at 50 seconds. That is workable for many dashboards until you mix heavy aggregations, large result sets, and analyst expectations. Users did not fail gracefully—they hit walls.
JVM Heap and Circuit Breaker Pressure
With the heap sized to 24 GB on data nodes, we still saw the kind of log lines that make an SRE pause: circuit breaker activity, G1 collections under pressure, and "before/after" heap numbers that told us we were riding close to the edge during peak work. Log excerpts from April 2023 showed the cluster working hard under allocation pressure.
Kibana CSV Reporting at Scale
Field notes from testing spelled out the pain in plain language: a ~50 MB-class export could take on the order of 22 minutes once queue timeouts were widened enough to let the job run. Meanwhile, product expectations were moving toward 100–200 MB CSV configurations and faster turnaround. Default Kibana limits and task-manager behavior—timeouts, event-loop warnings, "max size reached" style failures—were part of the story. This is exactly the kind of problem that looks like "Elasticsearch is slow" when the bottleneck is often the reporting pipeline and node overhead.
There was also a practical governance angle from early 2023 conversations: teams asked whether CSV sizes could be capped differently per role (superuser vs standard users) and how Kibana's document download limits interact with real exports—questions that push you toward security, roles, and reporting architecture, not only cluster tuning.
Diagnosis
Separating the Data Plane from the Reporting Plane
I started where I always start: separate data plane issues from reporting plane issues.
On Elasticsearch, the index design for domain intelligence is intentionally wide: DNS, HTTP, WHOIS, SSL, nested topics, and large keyword/text surfaces. Example indices in the environment used 8–12 primary shards, one replica, and a one-hour refresh_interval—sensible for batch-heavy ingestion, but meaningful for how searches feel and how much work a single export can fan out to.
What the Kibana Experiments Revealed
On Kibana, the notes were explicit about experiments: raising xpack.reporting.csv.maxSizeBytes, increasing queue timeouts, adjusting scroll sizes, and even raising Elasticsearch http.max_content_length from 100 MB to 1 GB—which did not fix the stuck behavior by itself. That is an important lesson: lifting the HTTP ceiling is not the same as making CSV generation fast.
The breakthrough in testing was almost mundane: logging.root.level set to warn, combined with xpack.reporting.csv.scroll.size: 1500, turned a brutal job into a short one. In the same notes, a 200 MB export completed in about two minutes under that combination. Earlier, with scroll 5000, 70,000 documents took about nine minutes—and increasing scroll to 5000 did not reliably beat 1500 in later tests. Aggressive task-manager tuning was explicitly marked as a bad idea—those knobs trade stability for throughput in ways that bite you under Node event-loop pressure.
The Solution
We did not "optimize Elasticsearch" in the abstract. We aligned three layers.
Layer 1 — Search Reliability
We moved search.default_search_timeout from 50s to 120s where long-running analyst queries were legitimate, and kept investigating slow queries at the source rather than masking them with infinite timeouts.
Layer 2 — Data-Node Health
We kept the 24 GB heap in context with real GC and circuit-breaker signals—meaning index patterns, shard counts, and query shapes that do not repeatedly spike allocations during reporting.
Layer 3 — Reporting Throughput
We treated CSV generation as a Kibana scalability problem: logging verbosity, scroll sizing, queue timeouts, and when needed, horizontal Kibana or dedicated reporting nodes. Elastic's official Kibana production guide documents the dedicated reporting node pattern as the durable fix when a single instance becomes the bottleneck.
Across the engagement we also validated operational hygiene: task manager health endpoints, Kibana status, and payload limits (server.maxPayloadBytes) that can block large exports before Elasticsearch ever becomes the story.
If you have never watched a reporting job fail after minutes of "progress," it is worth stating plainly: users experience that as downtime even when search P99 looks fine. That is why we treated CSV throughput as product-critical, not an afterthought.
Results
Performance Numbers from Project Notes
These are the figures as recorded in the project notes—not a cherry-picked benchmark suite:
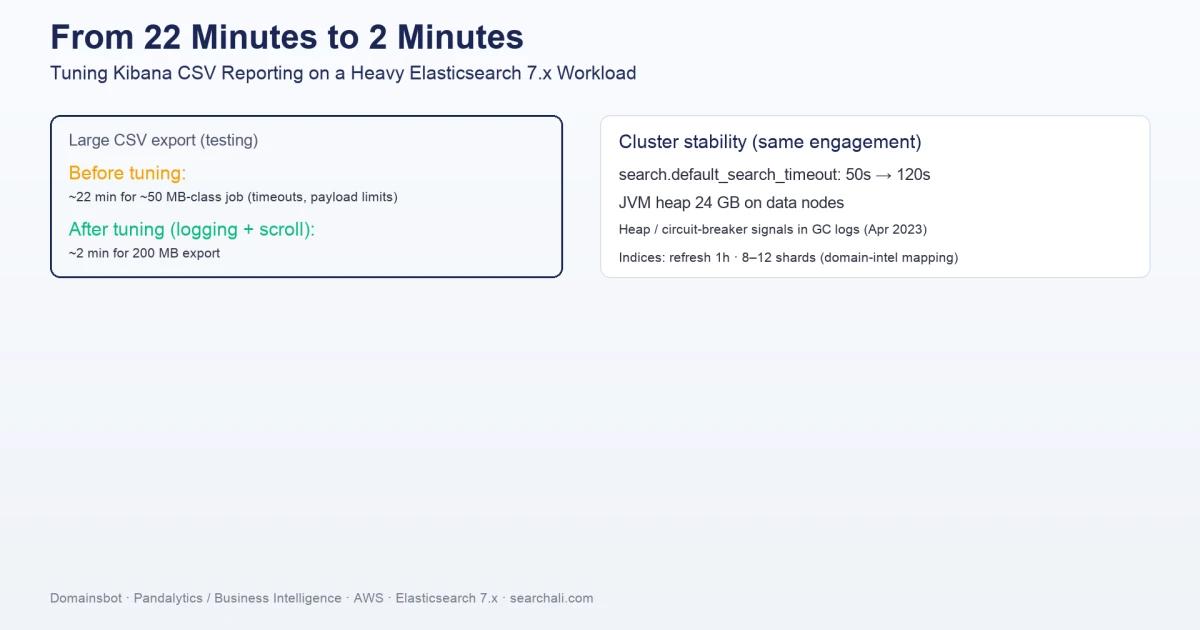
search.default_search_timeout: 50s → 120s- JVM heap: 24 GB on data nodes, with documented heap-pressure investigations tied to April 2023 logs
- CSV reporting (testing):
- ~22 minutes for a ~50 MB-class job before the right combination of logging and scroll tuning
- ~2 minutes for a 200 MB export after
logging.root.level: warnandxpack.reporting.csv.scroll.size: 1500 - ~9 minutes for 70,000 documents with scroll tuning experiments (1500 vs 5000 compared in notes)
Those pairs are not a perfect apples-to-apples benchmark—different row widths, filters, and caches will move the numbers. They are still honest evidence that the dominant cost was not always Elasticsearch query time; it was how Kibana executed and logged the work.
Key Takeaways
What This Engagement Taught Us
- Wide, mapping-heavy indices (DNS/WHOIS/topics) change the cost model for CSV exports; shard count and scroll behavior matter as much as "query speed."
- Raising
http.max_content_lengthalone did not unblock large CSVs in this environment; the fix lived in Kibana reporting settings and logging overhead. logging.root.level: warnwas the unexpected lever that turned multi-minute nightmares into short runs alongside scroll tuning—CPU and event-loop pressure are real.- Aggressive task-manager extremes looked attractive in theory and were rejected in practice; Elastic's guidance on scaling Kibana exists for a reason.
- Mixed major versions (legacy Elasticsearch 2.x alongside 7.x on AWS) increase operational load; treat compatibility and migration as a product risk, not a background task.
Need help stabilizing your Elasticsearch or OpenSearch cluster? SearchAli offers hands-on consulting and corporate training for teams running production Elastic Stack workloads.