Dais Technology is an insurtech. Their platform sells and services protection plans for retail partners, and the system of record is Postgres—including JSONB columns that hold entire workflow states as nested JSON, sometimes JSON serialized inside JSON. Search, however, lives in Elasticsearch on AWS: type a transaction ID, a customer name, or half a SKU, and the UI has to answer instantly across sales and claims.
The first call gave me a short, honest symptom list: indexing latency, updates showing up late on the web page ("probably because of the cache"), aggregation questions, full-text search behavior to review, cluster on AWS. That list turned out to be one story, not five.
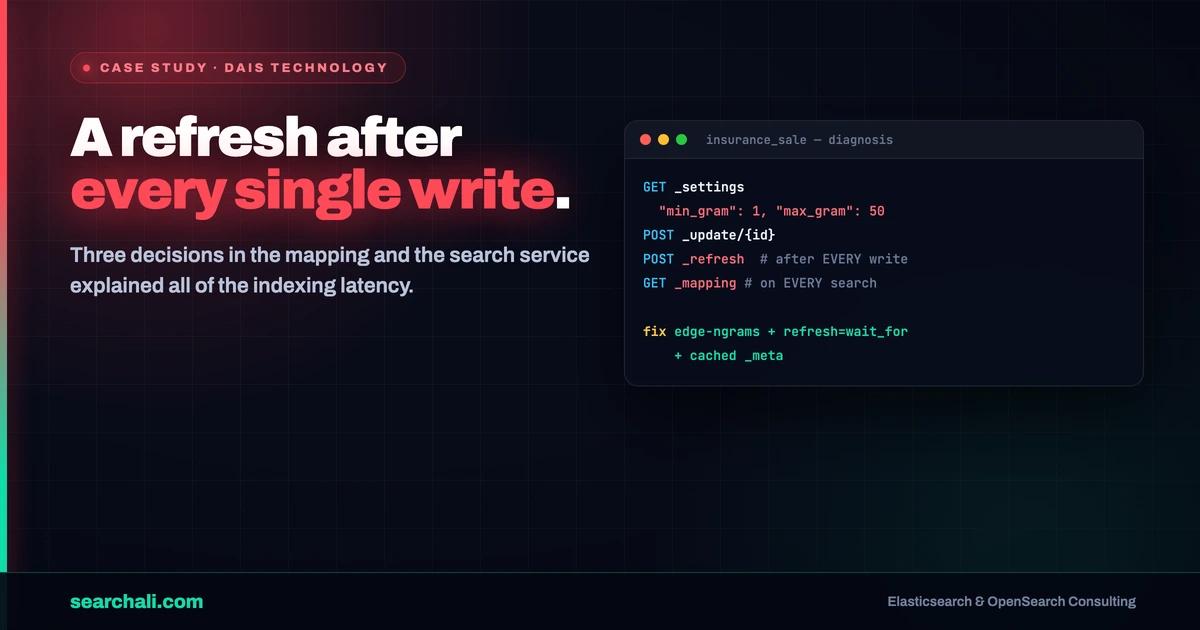
Quick answer: Dais syncs Postgres rows—flattening JSONB with ->/->> operators—into per-entity Elasticsearch indices shaped as data + metadata, with role and tenant security stored in the mapping's _meta and enforced as query-time filters. The latency complaints traced to three compounding decisions: an ngram tokenizer indexing every 1-to-50-character fragment of every text field, an explicit refresh after every single document write, and a get_mapping round trip on every search. Each is fixable without changing what the user sees.
Challenge
The estate was Amazon OpenSearch Service in us-west-2 running Elasticsearch-engine domains on 7.1 and 7.10, all VPC-only, one domain per environment (dev, integration, UAT, production). The insurance_sale and insurance_claim indices are the heart of the product: staff and retail partners search them constantly, and every sale or claim update in Postgres must become searchable quickly.
Two services own the pipeline. A Java service holds field-by-field index definitions (sale.json, claim.json) and initializes indices in code. A Python search microservice wraps the Elasticsearch client for the frontend: it builds queries, posts documents as doc_as_upsert updates, and enforces permissions. A Logstash JDBC prototype—Postgres driver jar, a JSON-flattening SELECT using info ->> 'customer'-style operators, a cron schedule—covered the database-sync angle.
The complaints were user-visible: writes felt slow, and a freshly edited sale sometimes didn't show its new state on the page immediately.
Diagnosis
The 1-to-50 ngram tokenizer
The mapping is where the indexing latency lived. Every searchable text field—names, addresses, SKUs, product descriptions—was analyzed with a custom ngram_analyzer:
"tokenizer": {
  "ngram_tokenizer": {
    "type": "ngram",
    "min_gram": "1",
    "max_gram": "50",
    "token_chars": ["letter", "digit", "punctuation", "symbol", "custom"],
    "custom_token_chars": "_\\+/-"
  }
}
with max_ngram_diff: 49 to make Elasticsearch accept it. This buys "match any substring anywhere," but the cost is brutal: a 50-character product description emits on the order of a thousand tokens, per field, per document. Index size, segment merge pressure, and per-document indexing time all scale with it. The search side used a separate partial_text_search analyzer (whitespace + lowercase), so queries were cheap—all of the pain was concentrated at write time. Elastic's own ngram tokenizer docs hint at this by defaulting max_ngram_diff to 1.
Refresh after every write
The Python service ended every document post—and every bulk—with an explicit indices.refresh(). That explains the "updating latency on web page" report: the team had made writes synchronously visible to cover for it, and paid for it in indexing throughput. Forcing a refresh per write creates many tiny segments and defeats Elasticsearch's batching model; under load it is one of the most reliable ways to make a cluster feel slow.
A mapping read per search
Role-based security was implemented in a clever place: the mapping's _meta block stores searchable_fields (with boosts like data.transactionId^10) and permission_metadata—an ordered role list where, for example, an admin role passes freely and a retail-partner role must be filtered by storeCode. The search service reads this _meta via get_mapping on every request, then builds a cross_fields multi_match with operator: and, a term filter on metadata.tenantId.keyword, role filters, and an impassable filter when no role matches. Correct design—but the extra get_mapping round trip on every query adds latency and cluster-state chatter for data that changes almost never.
Sharding by habit
The entity indices carried 5 primary shards + 1 replica—a 7.x-era default carried forward, not a sizing decision. For a single-entity search index, that multiplies small segments and per-shard overhead across the cluster.
Solution
The recommendations kept the user-facing contract intact:
- Bound the ngrams. Cut
min_gram/max_gramto a sane window (edge-ngrams for prefix search, or 2–3 to ~10 for infix), or move prefix cases tosearch_as_you_type/wildcard on keyword subfields. This is the single biggest indexing-latency lever in the pack. - Drop refresh-per-write. Use
refresh=wait_foron the specific write the UI is waiting on, and let the index-levelrefresh_intervalhandle everything else. Same read-your-own-write UX, none of the segment storm. - Cache the
_meta. Searchable fields and permission metadata change on deploy, not per query—cache them in the service with a short TTL and dropget_mappingfrom the hot path. - Right-size shards. One primary (plus replica) per entity index at this data volume; grow deliberately, not by default.
- Keep the good parts.
dynamic: falsemappings, thedata/metadatadocument split, tenant term filters, and boost-drivenmulti_matchare exactly how multi-tenant entity search should look. The Logstash JDBC path with Postgres JSON operators is a legitimate sync option next to app-level upserts.
We also stood up container-based Metricbeat monitoring against the production domain so that indexing pressure and refresh behavior became visible instead of anecdotal—the same visibility argument I make in the searchali.com monitoring work.
Results
Only what the evidence pack supports:
| Item | Evidence |
|---|---|
| Root causes identified for indexing/update latency | 1–50 ngram mapping, refresh-per-write, per-query get_mapping in code and mappings |
| Multi-tenant search security verified as query-time filters | _meta permission metadata + tenant term filter in the search service |
| Postgres JSON → Elasticsearch sync patterns documented | JDBC/Logstash prototype with ->> flattening; app-level doc_as_upsert path |
| Cluster monitoring deployed | Metricbeat container against the production domain, 10s pull interval |
Before/after latency percentages, index sizes, or throughput numbers: not in the source pack, so you won't read them here.
Key Takeaways
- Ngrams are an indexing-time loan.
min_gram: 1, max_gram: 50means every field pays ~O(length × 50) tokens. Bound the window or use edge-ngrams. - Never
refreshper write.refresh=wait_foron the one write that matters;refresh_intervalfor the rest. - "Page shows stale data" is usually a refresh-vs-cache question. Diagnose which layer before adding another forced refresh.
- Cache mapping-driven config.
_metais a great place for searchable fields and permissions—reading it per query is not. - Shard counts are decisions, not defaults. Five primaries for a modest entity index is 7.x inertia.
- Postgres JSON flattens cleanly.
info -> 'items' ->> 'qty'in the JDBC statement beats reshaping JSON in the pipeline.
Running search on AWS Elasticsearch/OpenSearch with Postgres as the source of truth and latency you can't explain? That's the exact shape of work I do → searchali.com