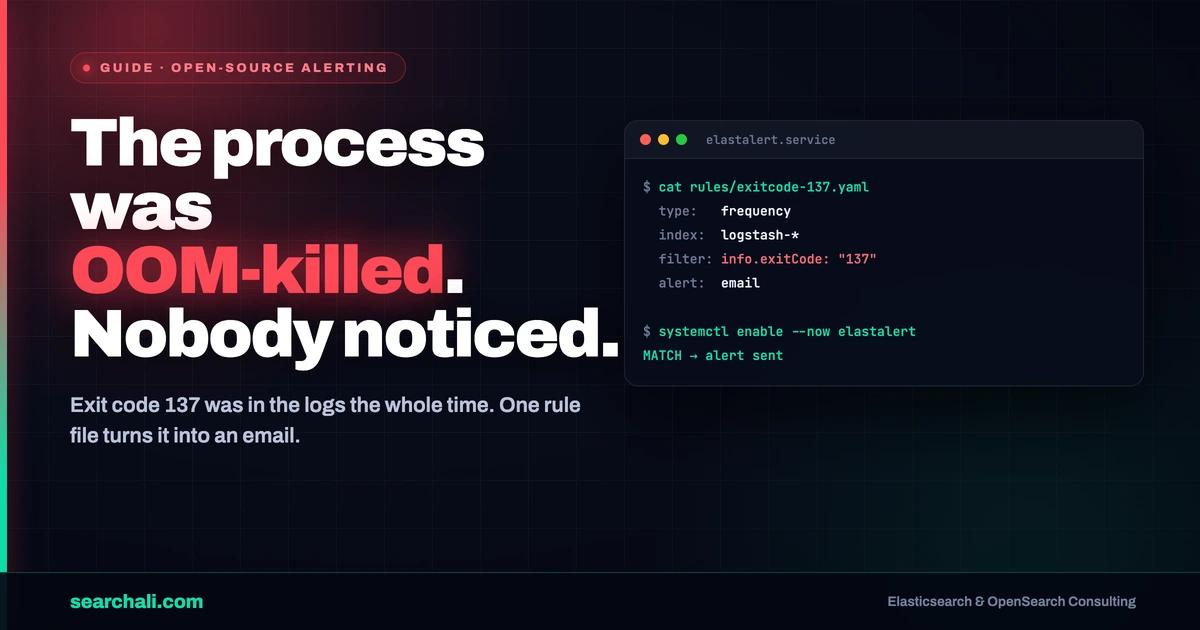
A container process dies with exit code 137. Nobody notices until a user complains. The logs were in Elasticsearch the whole time—info.exitCode: "137" sitting in a logstash-* index, unread. That is the gap ElastAlert2 closes: it queries Elasticsearch on a schedule and fires an alert the moment a match shows up.
This guide comes from a real engagement where we wired exactly that: a frequency rule watching for killed processes, a readable email template, and a systemd unit so the whole thing survives reboots. Everything below is sanitized (placeholder emails and hosts), but the configs are the working shape, not pseudocode.
Quick answer: ElastAlert2 is an open source alerting daemon for Elasticsearch. Each rule is a YAML file with four core blocks: type (when to fire, e.g. frequency), index (what to search), filter (the query DSL match), and alert (email, Slack, and dozens more). alert_subject and alert_text with _args turn raw documents into readable notifications. Run it as a systemd service (WorkingDirectory=/opt/elastalert, ExecStart=/usr/bin/elastalert) so it polls 24/7. It fits when you want license-free alerting on any Elasticsearch distribution; Kibana alerting fits when you are on a licensed Elastic Stack and want everything in the UI.
Where ElastAlert2 fits vs Kibana alerting
Kibana has its own alerting framework, and if you run a licensed Elastic Stack it is a fine default: rules live in the UI, connectors are managed, and everything is upgraded with the stack. But several connector types sit behind paid tiers, and some teams run distributions where Kibana alerting is not an option at all.
ElastAlert2 is the community-maintained successor of Yelp's ElastAlert. It is a standalone Python daemon: it runs outside the cluster, executes queries on an interval, keeps its own state in writeback indices, and speaks to plain Elasticsearch over HTTP. That makes it attractive when you want elasticsearch alerting open source end to end—no license gate on email or Slack, rules as YAML files you can code-review in git, and one process you fully control. The tradeoff: it is one more service you have to run, monitor, and upgrade yourself. This guide covers exactly that operational part.
Anatomy of an ElastAlert2 rule
Here is the sanitized version of the rule from the engagement. The business goal: whenever any workbench process is killed with exit code 137 (SIGKILL—almost always an OOM kill in containerized setups), email the team within the hour.
# rules/workbench-exitcode-137.yaml

# (Required) Rule name, must be unique
name: workbench-exitcode-137

# (Required) Rule type: frequency fires when num_events
# matching events occur within timeframe
type: frequency

# (Required) Index to search, wildcards supported
index: logstash-*

# (frequency specific) fire on the first match within the window
num_events: 1
timeframe:
  hours: 1

# (Required) Elasticsearch filters, joined with AND
filter:
- match:
    info.exitCode: "137"

# (Required) What to do on a match
alert:
- "email"

alert_subject: "Alert: workbench exitCode 137"

alert_text_type: alert_text_only
alert_text: "
  This email contains error details, please do not respond \n
timestamp: {0}\n
machineInfo.user: {1}\n
info.command: {2}\n
info.exitCode: {4}\n
event.original: {3}"
alert_text_args:
- timestamp
- machineInfo.user
- info.command
- event.original
- info.exitCode

email:
- "alerts@example.com"
from_addr: "noreply@example.com"
type and index
type decides when the rule fires. frequency with num_events: 1 and a one-hour timeframe means "alert on the first match in any rolling hour"—effectively an any-match trigger with built-in windowing. Other types cover thresholds (num_events: 50), spike (rate doubled), flatline (data stopped—the absence alert every ops team eventually needs), and more; the full list lives in the ElastAlert2 rule types documentation. index accepts wildcards, so logstash-* sweeps daily indices without maintenance.
filter
filter is a list of Elasticsearch query DSL fragments joined with AND. Here a single match on info.exitCode does the job. Anything you can express in query DSL works—term, range, query_string—which means you can prototype the query in Kibana Dev Tools first and paste it in once it returns the right documents.
alert
alert is a list, so one rule can notify multiple channels. Email is the classic; Slack is a two-line swap:
alert:
  - slack
slack_webhook_url: "<your_webhook_url>"
Alert text templating: subject, from, to
By default ElastAlert2 builds the email body as rule_name + [alert_text] + ruletype_text + {top_counts} + {field_values}—complete but noisy. Three settings tame it:
alert_text+alert_text_args: a template with{0},{1}, ... placeholders filled from document fields. Note in the rule above the args order and placeholder order differ ({4}isinfo.exitCode)—the index refers to the position inalert_text_args, so keep the mapping honest.alert_text_type: alert_text_onlydrops the auto-generated tail so recipients see only your template.exclude_fieldsis the middle ground: keeps counts, drops the raw field dump.alert_subject+alert_subject_argstemplate the subject line the same way, e.g.alert_subject: "High response time at {0}"with- "@timestamp".
Delivery settings live either in the rule or globally in config.yaml:
email:
- "alerts@example.com"
- "oncall@example.com"
from_addr: "noreply@example.com"
smtp_host: "smtp.example.com"
smtp_port: 25
smtp_ssl: true
smtp_auth_file: "/opt/elastalert/smtp_auth_file.yaml"
Keep SMTP credentials in smtp_auth_file, not in the rule file—rules belong in git, credentials do not.
Running ElastAlert2 as a systemd service
Running elastalert in a tmux session is how alerting quietly dies during the next reboot. The fix is a minimal systemd unit—this is the exact shape we used:
# /lib/systemd/system/elastalert.service
[Unit]
Description=elastalert
After=multi-user.target

[Service]
Type=simple
WorkingDirectory=/opt/elastalert
ExecStart=/usr/bin/elastalert

[Install]
WantedBy=multi-user.target
Then link, reload, enable, start:
ln -s /lib/systemd/system/elastalert.service /etc/systemd/system/elastalert.service
systemctl daemon-reload
systemctl enable elastalert.service
systemctl start elastalert.service
systemctl status elastalert.service
WorkingDirectory matters: ElastAlert2 resolves config.yaml and the rules/ folder relative to it. Adjust ExecStart to your install path (a virtualenv binary or python -m elastalert.elastalert), and consider adding Restart=on-failure so a crashed daemon comes back on its own. journalctl -u elastalert -f becomes your alerting log from that point on.
Before you alert: make sure the field exists
An ElastAlert2 filter can only match fields that exist. info.exitCode was queryable because ingestion parsed it out of the raw line first. When your logs are still one unparsed message string, fix that before writing rules—Kibana Dev Tools ships a Grok Debugger for exactly this: paste a sample line, try a pattern like %{COMMONAPACHELOG}, and watch it explode into response, clientip, verb, timestamp fields. Structured fields first, alerts second. If you are unsure what your cluster is doing under alerting load, continuous monitoring tells you before your users do.
Key Takeaways
- Four blocks per rule:
type,index,filter,alert. Master those and every ElastAlert2 rule reads the same way. frequency+num_events: 1is the simplest useful trigger—alert on first match within a window.alert_text_type: alert_text_onlyplusalert_text_argsturns raw JSON into an email a human acts on.- Placeholder order ≠ args order.
{4}points at the fifth entry ofalert_text_args—double-check the mapping. - systemd, not tmux. A 12-line unit file plus
systemctl enableis the difference between alerting and hoping. - Parse before you alert. Validate fields with the Grok Debugger; a filter on a nonexistent field silently never fires.
No performance or volume metrics appear above because none exist in the source pack—this guide claims configs, not invented percentages.
Want alerting that actually pages someone before the customer does? → searchali.com
Frequently Asked Questions
Is ElastAlert2 free to use?
Yes. ElastAlert2 is open source (Apache-2.0) and runs against any Elasticsearch or OpenSearch cluster. Email, Slack, and the other alerters carry no license fee—which is the main draw over license-gated connectors in some Kibana tiers.
How often does ElastAlert2 run its queries?
The global run_every setting in config.yaml controls the polling interval, and buffer_time controls how far back each query looks. Rule types like frequency then apply their own timeframe windows on top of the returned events.
Can one rule send to both email and Slack?
Yes. alert is a list—put email and slack in the same rule, each with its own settings (email/from_addr/smtp_host and slack_webhook_url). The templated alert_subject and alert_text are reused across alerters.
Why is my rule matching in Kibana but not alerting?
The usual suspects, in order: the field is not parsed into your index the way the filter expects (verify with a Dev Tools query, not just Discover), the timeframe/run_every combination has not elapsed yet, or a previous match is inside realert suppression. --verbose and the elastalert_status writeback index show what each run actually queried and matched.