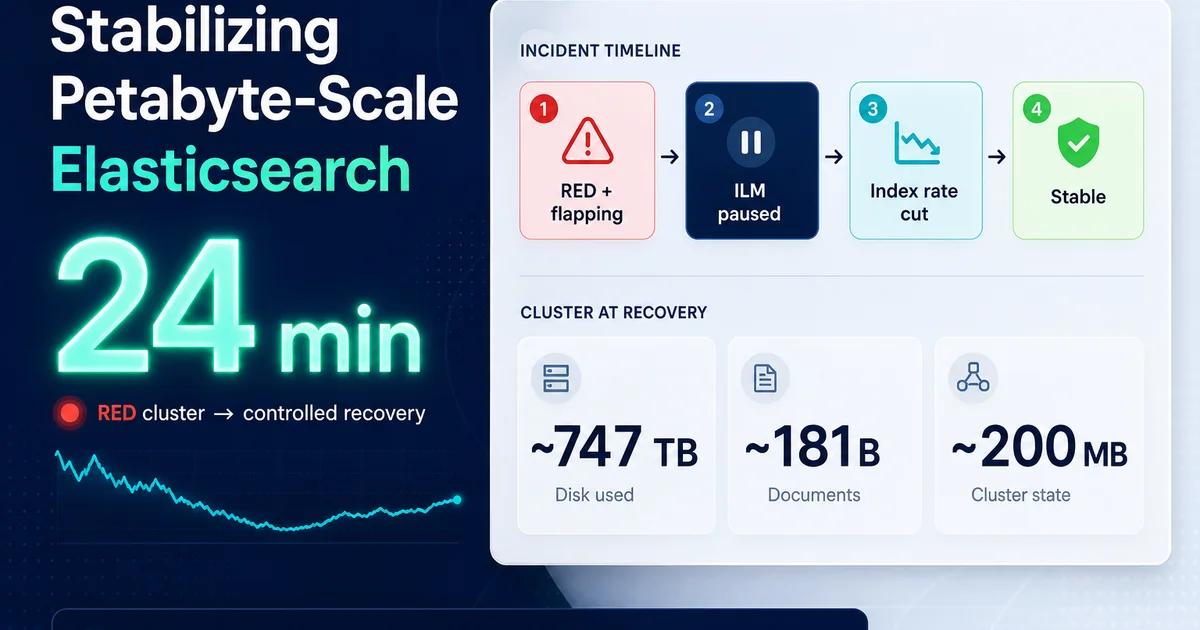
Imagine a single Elasticsearch cluster holding on the order of 180 billion documents, thousands of indices, and well north of 700 TB on disk—the analytical backbone for a global bot-management platform. That is not a cluster you “restart and hope.” When indexing backs up during attack spikes, coordinators run hot on garbage collection, and cluster state alone weighs hundreds of megabytes, every incident is a race between recovery machinery and incoming write load.
I was brought in as an outside pair of eyes to improve stability, reduce write rejections, and give the team short-term, actionable recommendations—without pretending a cluster this size can be “fixed” in a single sprint.
The Challenge
DataDome’s Elasticsearch estate is the heart of the application: roughly one index per customer on the order of 250 customers, with one very large tenant driving a substantial share of total volume (on the order of a quarter of the data). Traffic enters from many points of presence worldwide, flows through Kafka, and lands in Elasticsearch via bulk indexing—under normal conditions a resilient design, because Kafka can buffer when Elasticsearch says “not now.”
The pain showed up in ways operators at this scale know too well:
- Indexing rejections during traffic spikes (including attack-driven spikes), forcing downstream replay from overflow paths.
- High pending cluster tasks and slow cluster-state propagation—a predictable side effect when state is enormous.
- Elevated GC on coordinator-tier nodes and nodes leaving and rejoining under pressure.
- Prior full-cluster RED events where hot data nodes flapped while the cluster tried to reconcile shard allocation and recovery against heavy concurrent indexing.
The team already knew the long-term answer—splitting work across multiple clusters and continuing customer-specific migrations—but they needed stability and clarity *now*, plus a credible path on versions and operations.
Diagnosis
Cluster-state weight and operational drag
At this scale, cluster state on the order of ~200 MB is not a rounding error. Every master election, settings change, and ILM-driven rollover competes for the same machinery. When something pushes thousands of ILM rollover actions into the pending queue—as happened during a September 2023 incident—the cluster does not feel “a little slow.” It feels like it is underwater.
Recovery + indexing: a bad combination during incidents
Elasticsearch can struggle when it must simultaneously allocate/recover shards and absorb peak indexing. The practical playbook is blunt: reduce indexing pressure while recovery catches up, and in extreme cases pause ILM until the pending backlog clears. That is not theory—it's what we used when the cluster went RED after monitoring collection ramped up and the backlog exploded.
Ingest configuration vs. best practice
The ingest pipeline was configured with extremely large bulk batches—on the order of hundreds of MB per bulk—far above typical guidance for Logstash-style pipelines (commonly discussed in the single-digit MB range). Oversized bulks can amplify memory pressure and failure modes on hot tiers during spikes. The fix is not “tune one knob forever,” but validate smaller batches in testing and roll forward carefully.
Topology and traffic routing
At a high level, the architecture included hot / warm / cold style tiers and dedicated coordinator nodes. Operational findings pointed to classic patterns: indexing and search pressure landing where it should not, queues backing up, and circuit breaker activity signaling heap/fielddata pressure on busy nodes. The direction is standard but must be executed with discipline: send HTTP search/write traffic through coordinator paths, keep data-plane work on data nodes, and watch shard placement when a subset of nodes becomes “hotter” than neighbors.
The Solution
We did not treat this as a single “magic setting” project. The work combined immediate incident response patterns, settings and ingest hygiene, and roadmap alignment (version upgrades and cluster split / migration).
Incident response that matches Elasticsearch physics
When the cluster hit RED and hot nodes flapped, the priority was to stop adding new cluster-state work while the masters and data nodes reconverged. That meant:
- Stopping ILM temporarily (
_ilm/stop) when thousands of ILM rollover tasks were queued—freeing headroom. - Reducing indexing rate from Kafka to lower pressure while nodes rejoined.
- Waiting until pending tasks drained before re-enabling ILM (
_ilm/start).
The measured end-to-end stabilization window was about 24 minutes for that event—not “instant,” but controllable once the right levers were pulled in order.
Recovery tuning (directional)
To make recovery more predictable during large shard movements, we discussed raising recovery throughput and related concurrency settings (for example, increasing <code>indices.recovery.max_bytes_per_sec</code> from a lower baseline and tuning concurrent recoveries/rebalance limits). These changes are always environment-specific; the point is to avoid starving recovery while still not overwhelming disks and network.
Reducing ancillary load
Slowlogs can be invaluable, but they can also add overhead when enabled broadly via templates. The team disabled slowlog to reduce pressure during stabilization—an operational tradeoff, not a permanent philosophy.
Monitoring without destabilizing the cluster
Collecting metrics from a cluster this large is non-trivial. Approaches that work in small clusters can tip a giant cluster into trouble if they create timeouts, retry storms, or additional query load. We iterated on how monitoring was deployed—per-node collection, careful scope—because “more metrics” is not helpful if it triggers another RED state.
Roadmap: split, migrate, upgrade
The durable improvements were strategic:
- Splitting the monolith into multiple clusters (with a strong preference to cap node counts at a sustainable maximum—on the order of ~80 nodes per cluster as a planning anchor rather than an infinite sprawl).
- Accelerating customer-specific / regional moves (for example EU workloads) to reduce pressure on shared estates where discounts and topology made sense.
- A realistic Elasticsearch upgrade path (7.9 → 7.17 → 8.x) to unlock operational tooling (for example Kibana Upgrade Assistant) and version improvements around ILM behavior and heap efficiency at scale.
Results
I am not going to invent product KPIs that are not in the project notes. What we can stand behind are operational outcomes recorded during the work: recovery timelines, cluster-scale signals, and the behaviors we changed.
The most important “result” in an engagement like this is operational confidence:
- A repeatable playbook for RED scenarios: ILM pause → reduce ingest → drain pending tasks → re-enable ILM.
- A measured recovery window of ~24 minutes during a real incident where ILM rollover tasks had stacked up at scale.
- Clear identification of giant bulk sizing as a risk factor worth testing down.
- Alignment on cluster splits and upgrades as the real cost/stability win—not perpetual tuning on an impossibly large single cluster.
Key Takeaways
- At hundreds of nodes and hundreds of TB, cluster state size matters. ILM and rollover can become a coordinated storm if the cluster is already near its operational ceiling.
- During incidents, indexing and recovery compete. You must throttle ingest and sometimes pause ILM to let Elasticsearch finish mechanical work.
- Ingest batch sizing should be validated against memory and failure modes—defaults that “work” at small scale can hurt at petabyte scale.
- Monitoring should be introduced like a production change—because on a cluster this big, it *is* one.
- The long-term fix is architectural (split clusters, targeted migrations, upgrades), not perpetual heroics on a single giant estate.
Need help with your Elasticsearch cluster? Reach out at searchali.com. For ILM behavior at scale, see Elastic’s Index lifecycle management docs.