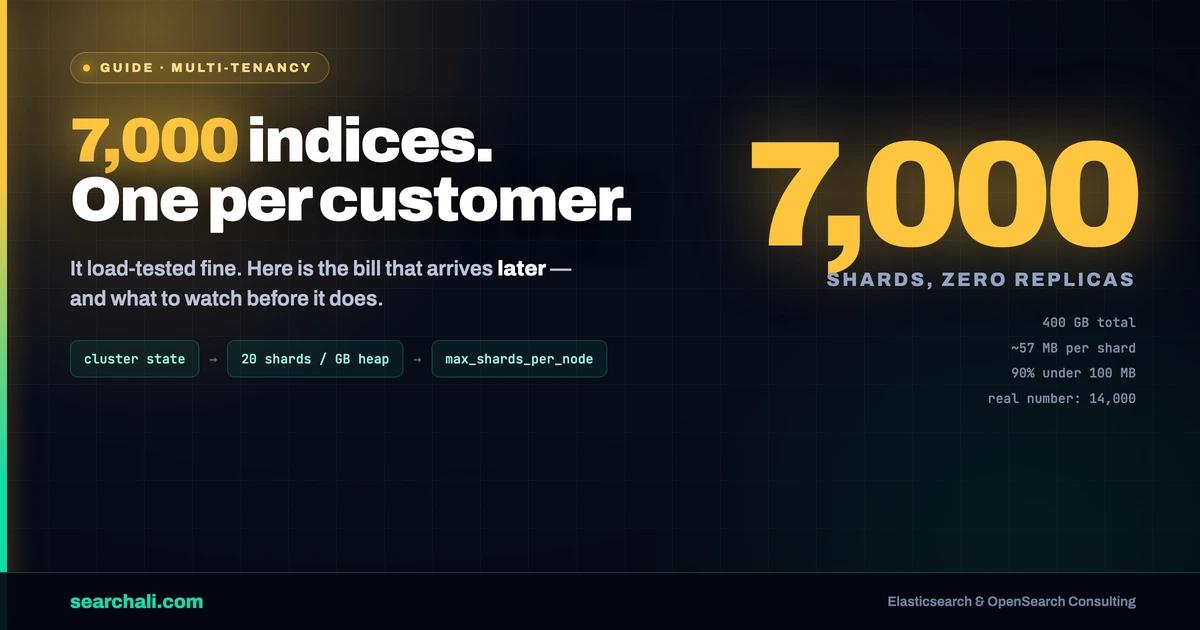
A fintech due-diligence platform came to me with a number that makes most Elasticsearch consultants flinch: 7,000 indices, 7,000 shards, 400 GB of data in the prod cluster. One index per customer account. 90% of those indices held less than 100 MB. Elasticsearch 7.x, 20 GB heap, production launch a month away.
Their own load test said 7,000 indices with 3 TB "works fine"—and honestly, it did. Their first question was the right one: why is this not a problem yet? And their second was even better: set up monitoring before it becomes one. This guide is the answer I gave them.
Quick answer: Thousands of tiny indices work on day one because idle shards are cheap in 7.x and 400 GB is nothing for modern hardware. They stop working when cluster state, per-shard heap overhead, and the cluster.max_shards_per_node ceiling catch up with growth—usually right when traffic does. Budget shards per GB of heap, watch per-index index/search rates in Stack Monitoring, track GC, and plan a consolidation path before the tenant count doubles.
The setup: one index per account
The tenancy model was the simplest one there is: every account gets its own index. It has real advantages—per-tenant deletes are a DELETE index, per-tenant mappings are trivial, and access control is easy to reason about. With 90% of users on the free tier, most of those indices sit nearly empty.
Do the arithmetic on the cluster:
400 GB / 7,000 shards ≈ 57 MB average per shard
Elastic's own shard sizing guidance talks about shards in the 10–50 GB range. This cluster's average shard is three orders of magnitude smaller. That's not automatically fatal—but it means the cluster pays shard overhead 7,000 times to store what a handful of well-sized indices could hold.
One detail worth pausing on: 7,000 indices adding up to 7,000 shards means one primary and zero replicas per index. That was fine for a pre-production test. In production it means any single data node failure turns part of the dataset red. Replicas double the shard count—so the real production number to plan for was 14,000, not 7,000.
Why it works today
Three honest reasons the load test passed:
- 7.x is forgiving. Elasticsearch 7 cut per-shard heap cost significantly versus 6.x and made cluster state updates cheaper. A shard that receives no traffic mostly just sits there.
- The data is small. 400 GB—even 3 TB in the test—fits comfortably on ordinary nodes. Disk and I/O are not the bottleneck here.
- The traffic is small—for now. 90% free-tier users means most indices see near-zero index and search rate. The team themselves said it in the meeting: "the search rate will increase" after launch. That's the variable that changes.
Where it starts to hurt
Cluster state and the master node
Every index carries mappings, settings, and routing entries in cluster state. At 7,000 indices, every index creation, mapping update, or settings change makes the master republish a bigger state to every node. Signup spikes—each new account creating an index—turn into pending-task queues on the master.
Heap: the shards-per-GB rule
The classic 7.x rule of thumb is at most ~20 shards per GB of heap on each data node. With a 20 GB heap, that's roughly 400 shards per node. Hosting 14,000 shards (with replicas) inside that rule needs on the order of 35 data node-heaps—or the rule gets broken quietly and shows up later as GC pressure. The client explicitly asked for GC collection checks in monitoring. Right instinct: old-gen GC creep is how oversharding announces itself.
The hard ceiling
7.x ships with cluster.max_shards_per_node: 1000. Growth in accounts is linear growth in shards, and one day index creation simply fails with a shards_limit exception. Raising the setting is a bandage, not a plan.
Monitor before it bites
The second agenda item was monitoring, and for a cluster like this the checklist is specific, not generic:
- Per-index index rate and search rate in Kibana Stack Monitoring (the Indices tab)—the view we walked through in the meeting. In an index-per-tenant design this is per-tenant throughput for free: you see exactly which accounts get hot after launch.
- Cluster health and pending tasks —
GET _cluster/healthincludingnumber_of_pending_tasks; on this topology, master task backlog is the early smoke alarm. - GC and heap —
GET _nodes/stats/jvm, alert on old-gen collection time trending up, not just on a heap-percent threshold. - Shard count vs. limit — track total shards against
cluster.max_shards_per_node × data nodesand alert well before the ceiling. - Audit logs — an explicit client requirement; in a due-diligence product, knowing who queried what is a feature, not overhead.
If you don't want to babysit these by hand, this is exactly what I build at searchali.com monitoring.
The consolidation path
You don't have to abandon index-per-tenant overnight, but you need a destination:
POST /tenant_shared/_doc
{ "account_id": "acme", ... }
- Shared index + routing + filtered aliases: small (free-tier) tenants live in one shared index, routed by
account_id, each behind a filtered alias so application code barely changes. Big paying tenants keep dedicated indices—a hybrid that matches the 90/10 user split here almost perfectly. - Merge cold tenants: indices not written to in months are candidates for reindex-into-shared plus
DELETE. - ILM for whatever stays time-based (audit logs, activity trails), so retention is policy, not a cron script.
Was this implemented? I won't claim that—the evidence pack is a first-meeting note, with no follow-up results in it. What I stand behind is the diagnosis and the playbook above.
Frequently Asked Questions
How many indices is "too many" in Elasticsearch?
There's no single number—the budget is shards per GB of heap (~20/GB as a 7.x rule of thumb) and cluster-state size. 7,000 tiny shards on a 20 GB heap violates the spirit of that budget even when the cluster looks healthy at rest.
Is index-per-tenant an anti-pattern?
Not inherently. It's excellent for isolation, per-tenant deletes, and per-tenant mappings. It becomes an anti-pattern when tenant count grows unbounded and most tenants are tiny—exactly the 90% free-tier shape. Hybrid models (shared index for small tenants, dedicated for large) keep the benefits.
Why did the 7,000-index load test pass?
Because idle shards are cheap and 3 TB is small. Load tests that don't simulate the post-launch variables—rising search rate, replica shards, signup-driven index creation—validate the present, not the future.
What should I alert on first in an oversharded cluster?
Master pending tasks, old-gen GC time on data nodes, and total shard count vs. the max_shards_per_node ceiling. Those three fire before users notice anything.
Key Takeaways
- Do the division. Total data ÷ total shards is the fastest oversharding test there is; 57 MB average against a 10–50 GB target tells the story in one line.
- Count replicas in your plan. 7,000 shards at zero replicas is 14,000 in production—plan heap and node count for the real number.
- Budget ~20 shards per GB of heap on 7.x and check the
cluster.max_shards_per_nodeceiling before growth does. - Per-index monitoring is per-tenant monitoring in this design—use Stack Monitoring's index rate/search rate view as a free tenant dashboard.
- Alert on the master, not just the nodes—pending tasks and cluster-state churn are the earliest signals.
- Design the hybrid exit (routing + filtered aliases for small tenants) before you need it, not during the incident.
Running an index-per-tenant cluster and not sure how much runway you have? Reach out at searchali.com.