Vehicle telemetry looks easy on a whiteboard: devices send JSON, you index it, you draw dashboards. Then reality arrives. The devices don't send you "distance driven in the last 5 minutes"—they send cumulative counters. There is no driver name in the event, only a driverId. And the data never stops coming, so six months later your cluster is paying hot-tier prices to store documents nobody queries.
I spent a long engagement building exactly this on Elasticsearch for a vehicle tracking platform (buses, depots, dozens of fleet customers on one cluster). This guide is the distilled version: how to calculate differences between events with transforms and ingest pipelines, how to use the enrich processor as a lookup table, and how to keep the time series affordable with rollover and ILM. All examples are generalized from real production work—no invented numbers.
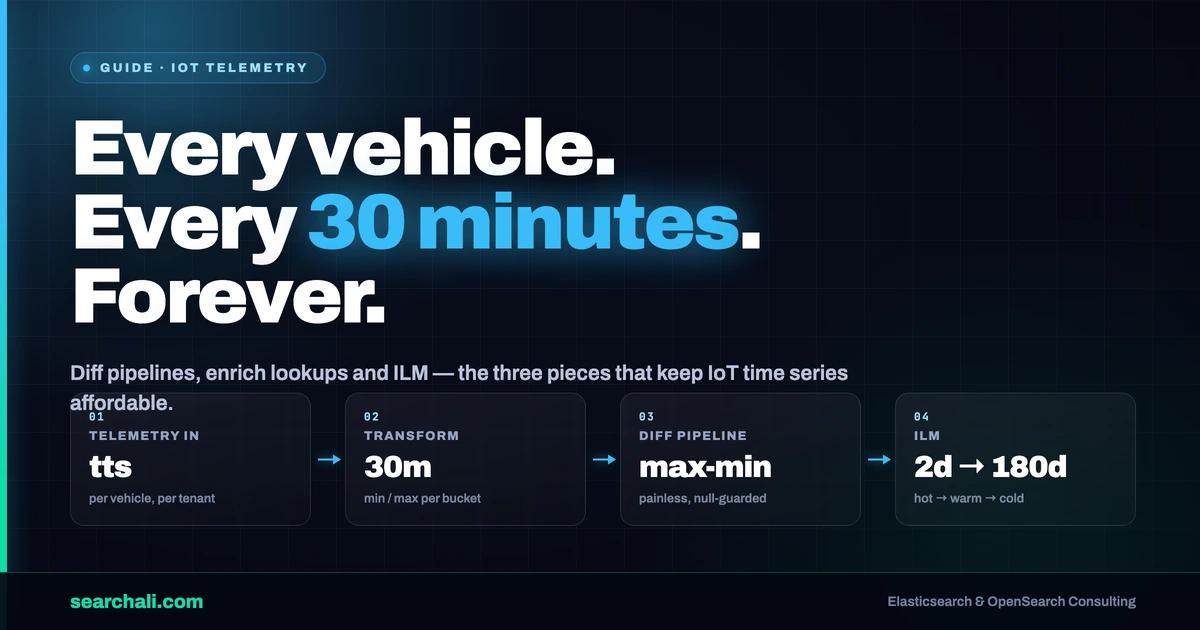
Quick answer: Don't compute deltas at query time. Run a continuous transform that groups events into time buckets per vehicle and emits min/max of each counter, then attach a diff ingest pipeline to the transform's destination index (ctx.field.diff = max - min). Join reference data (driver, shift, vehicle type) with enrich policies wired into the index's default_pipeline. Manage raw events with rollover + ILM on a hot-warm-cold topology, with one write alias and one search alias per tenant.
The shape of the data: counters, not deltas
A typical event from the fleet gateway looks like this (trimmed):
{
  "customerid": 2502,
  "vehicle": 3052,
  "category": "FMS",
  "tts": 1647613643,
  "CTD": 128403.5,
  "CTF": 20441.2,
  "dateandtime": "2022-03-18T14:27:23.000Z"
}
CTD is total distance, CTF total fuel, and there were ~30 such cumulative counters per event (electric usage, regen, temperatures...). The KPIs everyone wants—km driven, fuel consumed, energy used per vehicle per half hour—are all max(counter) - min(counter) over a window. Doing that with aggregations on every dashboard refresh is slow and repetitive. So we materialized it.
Step 1: a continuous transform that pivots events into windows
We prototyped the logic with POST _sql/translate (a SELECT min(...), max(...) GROUP BY is a fast way to design a pivot), then made it permanent:
PUT _transform/vehicle_kpi_transform
{
  "source": { "index": ["vehicle-events-*"] },
  "pivot": {
    "group_by": {
      "tts": { "histogram": { "field": "tts", "interval": "1800" } },
      "customerid": { "terms": { "field": "customerid" } },
      "vehicle": { "terms": { "field": "vehicle" } }
    },
    "aggregations": {
      "CTD.max": { "max": { "field": "CTD" } },
      "CTD.min": { "min": { "field": "CTD" } },
      "minDate": { "min": { "field": "dateandtime" } },
      "maxDate": { "max": { "field": "dateandtime" } }
    }
  },
  "frequency": "60m",
  "sync": { "time": { "field": "dateandtime" } },
  "dest": { "index": "vehicle_kpi", "pipeline": "diff_calculation_pipeline" }
}
In production the group_by also included driver name, shift name, and vehicle type, and the aggregations covered every counter. The transform ran hourly over 30-minute (1800 second) buckets, with a bulk size of 500 to keep pressure off the cluster.
Step 2: the diff-calculation ingest pipeline
The trick is dest.pipeline: every document the transform writes passes through an ingest pipeline that computes the deltas.
PUT _ingest/pipeline/diff_calculation_pipeline
{
  "processors": [
    {
      "script": {
        "lang": "painless",
        "source": """
          if (ctx.CTD.max != null && ctx.CTD.min != null) {
            ctx['CTD']['diff'] = ctx.CTD.max - ctx.CTD.min;
          }
        """,
        "ignore_failure": true
      }
    },
    {
      "script": {
        "lang": "painless",
        "source": """
          if (ctx.maxDate != null && ctx.minDate != null) {
            ctx['datetimediff'] = ChronoUnit.MILLIS.between(
              ZonedDateTime.parse(ctx['minDate']),
              ZonedDateTime.parse(ctx['maxDate'])) / 1000;
          }
        """,
        "ignore_failure": true
      }
    }
  ]
}
Three lessons from iterating this pipeline through v1 → v3 in production:
- Guard everything. The first version broke on documents where a field didn't exist or was empty. Null checks plus
ignore_failure: trueper processor kept one bad counter from killing the whole document. - Clean up zero-noise. v3 added
removeprocessors that drop a counter object entirely whencount,min,max,avg, ordiffis0—dashboards got noticeably cleaner. - Generate, don't hand-write. With ~30 counters, we generated the processor list with a small shell for-loop and
sedover a field list. One template, thirty processors, zero typos.
We also evaluated rollups for this job and hit hard walls: _rollup_search rejected exists queries, value_count metrics failed with "unable to unroll", and Kibana's search bar can't filter rollup indices at all. Transforms won. (Elastic has since deprecated rollups; use transforms.)
Step 3: enrich processors as lookup tables
Events carry vehicle and driverId, not human-readable names. An enrich policy is effectively a lookup table inside Elasticsearch:
PUT /_enrich/policy/driver-policy
{
  "match": {
    "indices": "driver_lookup",
    "match_field": "vehicle",
    "enrich_fields": ["driverId", "location"]
  }
}
POST /_enrich/policy/driver-policy/_execute
Then an ingest pipeline applies it, and the index's default_pipeline setting makes it automatic for every new document:
PUT /_ingest/pipeline/driver_lookup
{
  "processors": [
    { "enrich": { "policy_name": "driver-policy", "field": "vehicle",
                  "target_field": "tmp", "max_matches": 1 } },
    { "rename": { "field": "tmp.driverId", "target_field": "driverId" } },
    { "remove": { "field": "tmp" } }
  ]
}
PUT vehicle-events/_settings
{ "index.default_pipeline": "driver_lookup" }
In production the pipeline chained three lookups—driver name by driver id, shift name by shiftId, and vehicle type by a composite key built with a set processor ("{{customerid}}_{{vehicle}}"). Practical notes: use ignore_missing and ignore_failure on every enrich/rename step, re-run _execute when the lookup source changes (the .enrich-* index is a snapshot, not a live join), and remember you can't delete a policy while a pipeline still references it—Elasticsearch will refuse with "a pipeline is referencing it".
Step 4: rollover + ILM on hot-warm-cold
Telemetry never stops, so index lifecycle is not optional. The pattern we shipped, per tenant:
- An index template binds the pattern to a lifecycle:
index.lifecycle.name+index.lifecycle.rollover_alias, plus thedefault_pipeline. - The first index (
...-000001) is created manually carrying the write alias. - Two aliases per stream: the rollover alias for indexing, a search alias (or filtered alias per
customeridfor multi-tenant queries—we ran 24 of them on one template) for reading.
The production policy was aggressive because queries concentrate on recent data: hot rolls over at max age 2 days, data moves to warm immediately after rollover, to cold at 180 days, and stays there (no delete phase). On Elastic Cloud (v8.1.1) that ran as 2 hot + 2 warm + 2 cold data nodes plus 3 masters across two zones—2.46 TB total storage for about $2.27/hour, because most bytes sat on cheap warm/cold hardware instead of hot NVMe.
Two testing tips that save hours: drop indices.lifecycle.poll_interval from the default 10m to 15s while validating a policy, and size shards toward the 10–50 GB best-practice band before trusting any rollover threshold. Full mechanics are in Elastic's ILM documentation.
Key takeaways
- Materialize deltas. Continuous transform → destination pipeline →
max - min. Query-time math doesn't scale to fleets. - Null-guard every painless script and set
ignore_failureper processor; device data will always have missing counters. - Enrich = lookup table. Wire it through
index.default_pipeline, and re-execute the policy when reference data changes. - Two aliases per stream—write via the rollover alias, read via a search/filtered alias. This is what makes multi-tenant fleets manageable.
- Let ILM move data fast. Hot for days, not months; cold tier holds history at a fraction of the cost.
- Generate repetitive processors with a script. Thirty hand-edited painless blocks is thirty chances for a typo.
Frequently Asked Questions
How do I calculate the difference between two events in Elasticsearch?
For ad-hoc queries, use min/max aggregations and a bucket_script (we used exactly that for source-to-destination travel time with geo_distance filters). For anything a dashboard reads repeatedly, run a continuous transform with min/max aggregations and compute max - min in the destination index's ingest pipeline.
Can the enrich processor update documents when lookup data changes?
No. Enrich reads from a system .enrich-* index built when you _execute the policy. New documents get the values from the last execution; already-indexed documents don't change. Re-execute the policy on a schedule if your lookup table moves, and use _update_by_query if you need to backfill.
Should I use rollups or transforms for IoT telemetry?
Transforms. In our tests rollup search rejected exists queries, couldn't unroll value_count metrics, and Kibana couldn't filter rollup indices from the search bar. Rollups are deprecated; transforms have none of those limits and support a destination pipeline.
How long should telemetry stay on the hot tier?
Only as long as your ingest-heavy, recent-data queries need. Our production policy rolled over at 2 days of age and moved data to warm immediately—hot hardware is for indexing speed, not storage. Verify with your own query patterns, then let ILM do the moving.
If you want a second pair of eyes on your telemetry cluster—transforms, enrich design, or lifecycle cost—see how I approach Elasticsearch monitoring and health checks at searchali.com.