When a product team asks for “average player lifetime” and “who is active right now,” they are not asking for another Kibana widget. They are asking for correct time math on a high-volume event stream—and for definitions that do not change every time someone edits a visualization. I worked with LAI Games on that problem: turning raw online-arcade posts into player-level fields that product and operations could trust.
LAI Games builds location-based entertainment and digital arcade experiences. The data side looks like a firehose: signups, cabinet sessions, credits, tokens, tickets, and game-specific economics. Storing those events is the easy part. The hard part is encoding business rules—what counts as active, when lifetime starts and stops—without rewriting Painless inside every chart.
Challenge
The team needed analytics that product and ops could agree on:
- Average player lifetime — not a naive average of timestamps, but duration from signup until a player is treated as inactive for reporting.
- Active vs inactive segmentation so churned lifetimes are not mixed with people still playing.
- Monetization views that match product economics — pack pricing spans multiple currencies (USD/SGD/AUD) and per-game token costs differ from title to title. Dashboards had to use the right fields (absolute token amounts vs USD helpers) or charts lied.
None of that arrives free from a single index mapping. You need ingest-time computation and, for per-player rollups, continuous transforms—otherwise every analyst reinvents the same rule in a different visualization.
Diagnosis
Why “active” is not a field in the payload
Documents carry joined (when the account or entity started) and timestamp (when something happened). “Active” is a function of the gap between the latest activity and ingest time.
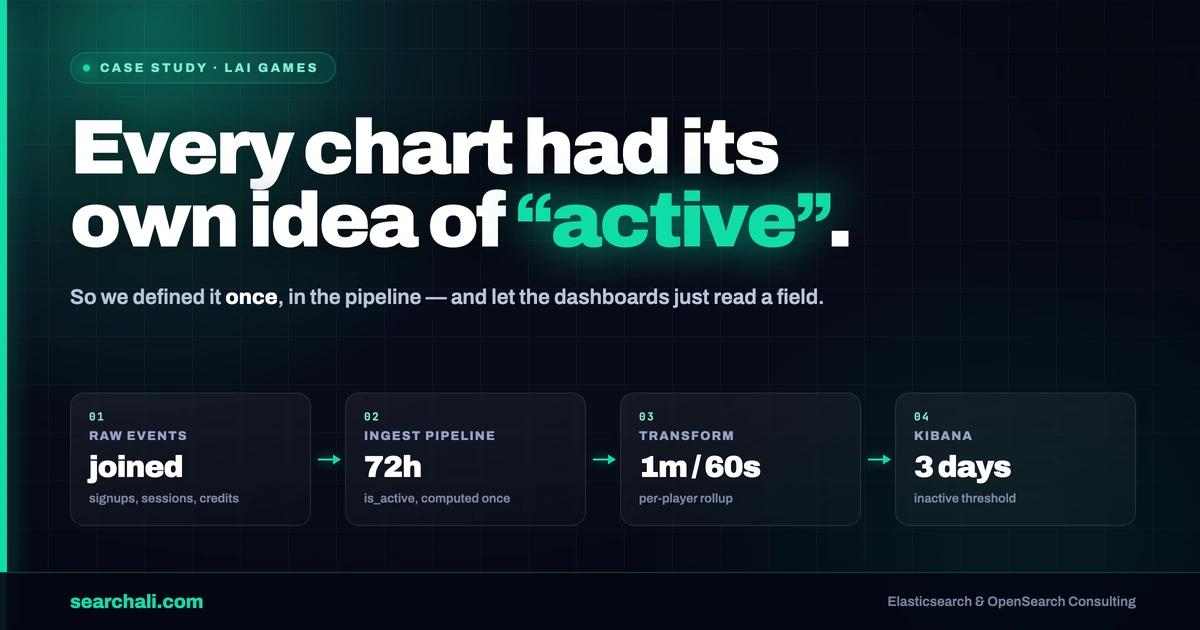
Early iterations in the notes used day-level differences (ChronoUnit.DAYS, threshold around three days). Production-oriented pipelines moved to hour-level comparisons (ChronoUnit.HOURS) so the active window matched how engineering talked about recency: activity within the last 72 hours marked a player as active (time_diff_hours <= 72). Separately, dashboard requirements described churn in calendar language: three consecutive days without activity as inactive for lifetime-style reporting. Those two ideas serve different layers—near-real-time activity flags vs product wording for lifetime—and they only stay consistent if you compute them in one place and write the rules down.
For player-level rollups, a continuous transform pivoted on a stable player key, aggregating max timestamp, max joined, and related fields, then pushed results through a destination ingest pipeline that applied the same Painless rules. The transform configuration in the materials ran on a one-minute frequency with a 60-second sync delay and max_page_search_size of 500—concrete operational settings we used as levers for freshness versus load.
We also tightened KQL guardrails for fair lifetime samples—for example, excluding players who registered in the last three days when the question is “how long do established players stay,” so onboarding noise does not skew averages.
Solution
We standardized on three layers:
Ingest pipelines with Painless that set an ingest timestamp, normalized latest activity and joined into parseable
ZonedDateTimefields, computedis_activefrom the hour gap, and optionally computed lifetime-style fields when the player was not active—so you do not mix churned lifetimes with people still playing.Continuous transform from time-partitioned player event indices into a destination index purpose-built for analytics, with the destination pipeline ensuring the same definitions land in every document.
Kibana dashboards (leaderboards, token spend, sessions, payouts, tickets) built on fields that were already interpreted, reducing one-off scripted metrics. Field hygiene mattered: notes called out token pie charts using the wrong monetary helper (AbsUsd showing fractions when the expected token scale was different) and fixed the aggregations to product rules.
We split concerns the way the team already thought about their roadmap: operations-oriented views (capacity, stickiness, concurrent usage) versus product-oriented game and monetization questions (“which game earns more,” “which is played more,” regional breakdowns across markets such as Australia, the United States, and Singapore). That separation does not change Elasticsearch mechanics, but it does change which aggregations you precompute and which filters you guarantee in the transform.
I keep infrastructure identifiers out of public write-ups: index patterns, internal environment names, and cabinet IDs stay generalized. What matters is the pattern, not a cluster label. For how transforms and ingest pipelines fit together in Elastic’s model, the Elasticsearch transforms documentation is the canonical reference; the engagement was about applying that pattern to arcade-scale player events.
Results
The source materials do not include a dollar-denominated Elasticsearch bill or a percentage “cost cut,” so I will not invent one. What we can state from the project files:
- Active rule in pipeline logic: ≤72 hours between last aggregated activity and ingest time →
is_active: true. - Transform operational profile: 1 minute frequency, 60 seconds sync delay,
max_page_search_size500. - Business wording for churn-style reporting: three consecutive days without activity treated as inactive for lifetime-style metrics in dashboard specs.
- Monetization reference values in notes: multi-currency pack price points and per-title token costs, used to reconcile KPIs with product economics. (Exact figures stay in the client materials.)
Those are the numbers I can sign next to because they are in the client materials. Anything beyond that is a follow-up measurement pass on their cloud bill or an A/B on transform frequency—not something I will fabricate for a prettier headline.
Key Takeaways
- Define “active” and “lifetime” in one layer (ingest or transform output), then let dashboards read fields—not reimplemented scripts.
- Match time units to the business: hours for recency windows, days for churn language—document both instead of silently mixing them.
- Continuous transforms are the right tool when you need per-entity latest state from a stream of events, but they need the same ingest discipline as any other production pipeline.
- Visualization bugs often trace to field choice, not Elasticsearch itself—validate token and currency fields against product rules before publishing exec-facing charts.
- If a metric is not in the evidence pack, say so. Credibility beats a fake percentage.
Need help with Elasticsearch analytics architecture? Start at searchali.com.