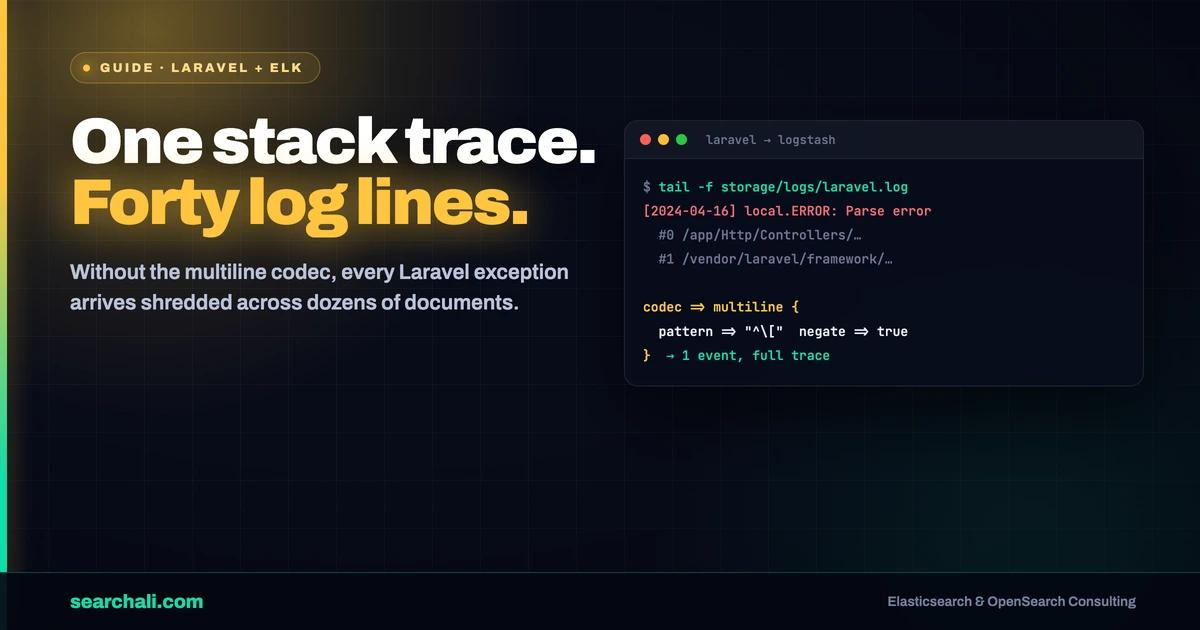
Every Laravel app writes the same file: storage/logs/laravel.log. And on most teams, that file is read the same way—ssh into the box, tail -f, grep for ERROR, hope you are on the right server. That works until you have two app servers, or one bad deploy at 02:00.
This guide is based on a small pipeline a developer's team put together to get Laravel logs into the ELK stack: a Vagrant box running Elasticsearch, Logstash, and Kibana, plus a Logstash config that actually understands Laravel's log format—including the multi-line stack traces that break naive parsers. I have cleaned it up, flagged what's dated, and kept the parts that still teach the right lesson.
Quick answer: Laravel (via Monolog) writes lines shaped like [2016-04-16 17:26:30] local.ERROR: <message>, with stack traces spilling onto following lines. In Logstash, join those continuation lines to their parent event with a multiline codec (pattern => "^\[", negate => true, what => "previous"), then grok the header with \[%{TIMESTAMP_ISO8601:timestamp}\] %{DATA:env}\.%{LOGLEVEL:severity}: %{GREEDYDATA:log_message}, set @timestamp with a date filter, and point the elasticsearch output at your cluster. Now severity:ERROR is a query, not a grep.
Why Laravel logs belong in Elasticsearch
Laravel's default logging is honest but flat. One file, one line per event—except when it is twenty lines, because an exception brought its whole stack trace. The format is stable, which is the good news:
[2016-04-16 17:25:45] local.INFO: Hello logstash
[2016-04-16 17:26:30] local.ERROR: Symfony\Component\Debug\Exception\FatalThrowableError: Parse error: ...
Stack trace:
#0 [internal function]: App\Providers\RouteServiceProvider->...
Three fields are hiding in that header: a timestamp, the environment (local, production), and the severity (INFO, ERROR). Once those are real fields in Elasticsearch, you get the questions Kibana is built for: errors per hour, which environment is noisy, what changed after the deploy. Left in a flat file, every one of those questions is a shell one-liner someone has to remember.
The two problems in Laravel's log format
Problem 1: stack traces are multi-line
A line-oriented shipper treats every line as an event. Feed the sample above through one and you get a useless index: one clean ERROR document followed by twenty orphan documents that start with #3 /home/...—no timestamp, no severity, no way to group them back together.
The fix in this pipeline is the multiline codec on the input. The logic reads exactly like the log format: a real Laravel event starts with [. Anything that doesn't, belongs to the previous event.
codec => multiline {
    pattern => "^\["
    negate => true
    what => "previous"
}
That is the single most important block in the whole config. Get it wrong and no grok pattern can save you, because the events themselves are already broken.
Problem 2: the header needs grok
The original config's grok pattern was:
\[%{TIMESTAMP_ISO8601:timestamp}\] %{DATA:env}\.%{DATA:severity}: %{DATA:message}
It works, and it demonstrates the right idea—env and severity split on the dot, timestamp captured whole. But two details are worth fixing before production. First, %{DATA} at the end of a pattern is lazy and can match nothing; use %{GREEDYDATA} for the trailing message. Second, grokking into message without overwrite gives you an array containing both the raw line and the parsed value—confusing in Kibana. Either overwrite it or use a new field name. Elastic's grok filter documentation covers both behaviors.
A sanitized, production-shaped config
Here is the same pipeline, modernized and pointed at Elasticsearch instead of stdout:
input {
  file {
    path => "/var/www/app/storage/logs/laravel.log"
    start_position => "beginning"
    codec => multiline {
      pattern => "^\["
      negate => true
      what => "previous"
    }
  }
}

filter {
  grok {
    match => {
      "message" => "\[%{TIMESTAMP_ISO8601:timestamp}\] %{DATA:env}\.%{LOGLEVEL:severity}: %{GREEDYDATA:log_message}"
    }
  }
  date {
    match => ["timestamp", "yyyy-MM-dd HH:mm:ss"]
    target => "@timestamp"
  }
}

output {
  elasticsearch {
    hosts => ["https://<your-elasticsearch-host>:9200"]
    index => "laravel-logs-%{+YYYY.MM.dd}"
  }
}
The date filter matters more than it looks: without it, @timestamp is when Logstash read the line, not when the error happened. Replay an old log file and everything piles up at ingestion time. With it, a replayed file lands on the correct timeline.
Verify from the outside, the same way the original README did:
curl "http://localhost:9200/laravel-logs-*/_search?pretty&q=severity:ERROR"
If severity comes back as a field with ERROR in it, the pipeline is doing its job.
A local ELK lab with Vagrant
The second half of the source material is a lab: a Vagrant box (Ubuntu, 2 CPUs, 2 GB RAM) that provisions Java, Elasticsearch, Kibana, and Logstash, forwards ports 5601 and 9200 to the host, and mounts the working directory into the VM. The workflow was pleasantly tight:
vagrant up
vagrant ssh
cd /vagrant/logstash-laravel-logs
/opt/logstash/bin/logstash -f logstash.conf < logs/laravel.log
Piping a sample log file into Logstash on stdin is still the fastest grok feedback loop I know: edit pattern, re-run, read the parsed output. No agents, no restarts, seconds per iteration.
Be aware the lab's versions are museum pieces—Elasticsearch 2.x, Logstash 2.0, Kibana 4.3.1, and the logstash agent subcommand that later versions dropped. The pattern-testing workflow transfers unchanged to a modern stack; today I would run current Elasticsearch and Kibana in Docker Compose and keep the exact same stdin trick. For a production path, also consider Filebeat doing the multiline assembly at the source and Logstash (or an ingest pipeline) doing the grok. And once logs are flowing, watch the cluster you are writing into—that is the part teams skip, and it is what searchali.com/en/monitoring exists for.
Key Takeaways
- Multiline first, grok second. Assemble stack traces into one event with
pattern => "^\[",negate => true,what => "previous"before any parsing. - Split
env.severityin the grok.%{DATA:env}\.%{LOGLEVEL:severity}turns Laravel's header into two filterable fields. - Prefer
%{LOGLEVEL}and%{GREEDYDATA}over%{DATA}for severity and trailing message—stricter matches, fewer surprises. - Use a
datefilter so@timestampreflects the event, not the ingestion—critical when replaying old files. - Test grok on stdin with a sample file before touching production shippers; it is the cheapest iteration loop available.
- Don't grok into
messagewithoutoverwrite, or you'll index an array of raw-plus-parsed.
Frequently Asked Questions
What is the grok pattern for Laravel logs?
\[%{TIMESTAMP_ISO8601:timestamp}\] %{DATA:env}\.%{LOGLEVEL:severity}: %{GREEDYDATA:log_message} matches the standard Monolog line format Laravel writes, capturing timestamp, environment, severity, and the message body as separate fields.
How do I handle Laravel stack traces in Logstash?
Use a multiline codec (or Filebeat's multiline settings) with pattern => "^\[", negate => true, what => "previous". Every line that does not start with [ is appended to the previous event, so an exception and its full stack trace become one Elasticsearch document.
Should I still use Logstash for this, or Filebeat?
For a lab or a single server, Logstash reading the file directly is fine. On real fleets, run Filebeat on the app servers (doing multiline assembly there) and send to Logstash or an Elasticsearch ingest pipeline for the grok step. The pattern itself is identical in both places.
Can I skip parsing and log JSON from Laravel instead?
Yes—Monolog can emit JSON, and structured logging beats regex parsing when you control the producer. Grok earns its keep on the logs you already have: years of plain-text laravel.log files, vendor boxes, or apps you cannot redeploy today.
Want the cluster side of this pipeline watched as carefully as the app side? → searchali.com