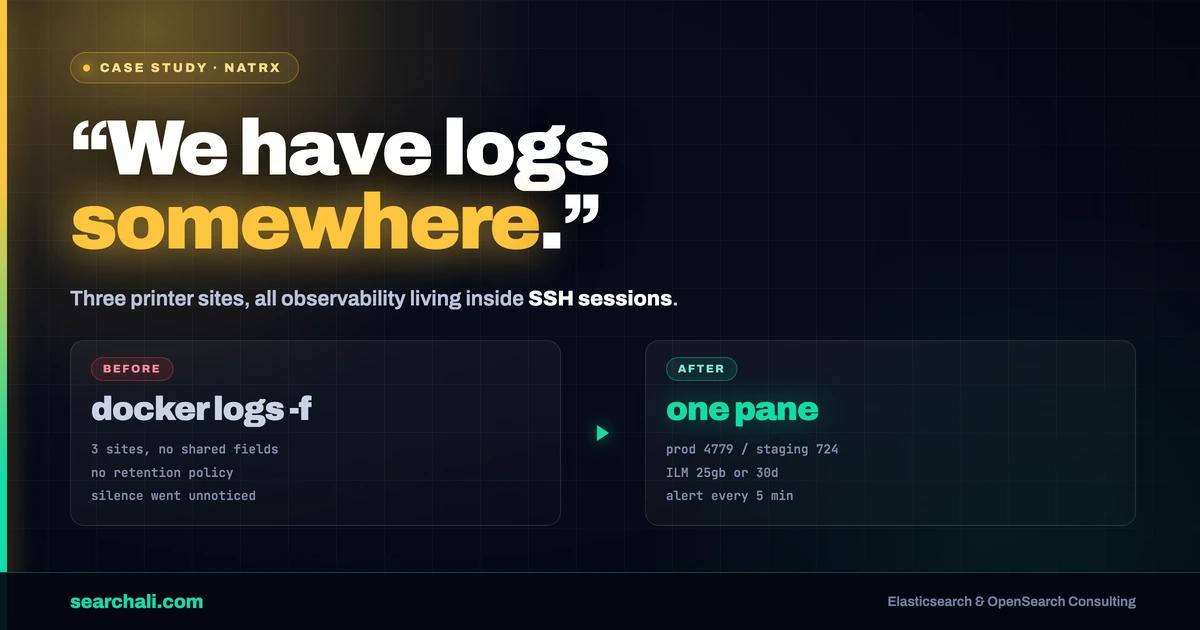
Three WASP sites. Server, frame, and pumps on the edge. Logs living in SSH sessions and docker logs -f. That is where Natrx started—and why “we have logs somewhere” was not observability.
They asked for security and metrics first: reliable delivery into Elasticsearch, production vs staging separation, lifecycle limits, and alerts when a device goes silent. I helped them build that Elastic visibility layer. Here is what actually shipped—only numbers we can point to in the evidence pack.
Challenge
Natrx is a climate-tech manufacturer; WASP is the on-site production stack: printer server, frame controller, multiple pumps, Raspberry Pi nodes, MQTT/AMQP, VPN into AWS. The Elastic problem was operational, not academic.
Their own expectations were blunt and correct:
- Security and metrics first; data streams; production vs staging
- Lifecycle limits; reliable delivery; Logstash failure visibility
- Infrastructure health; bad-pump / print dashboards
- Alerts when logs stop; backup node
Architecturally the intent was already right: not search-as-product, but visibility, tracking, and alerting—Filebeat on printers, HTTP sensors, app clients, Kibana on top with templates, data streams, and downtime/error alerts.
At the time of our index-strategy discussion they had three locations, each planned as a WASP installation with tags for server, frame, and pump. Sensor data was associated with a site, not always with a specific printer—another reason field design and tagging mattered.
On AWS (us-east-2) an ELK instance was already present as an m4.large alongside Airflow, Traefik, and related services. Traefik access logs showed the usual mix of healthy and noisy HTTP traffic. The gap was not “buy another tool.” The gap was making Elastic the system of record for edge health.
Diagnosis
Three failure modes showed up repeatedly.
Unstructured and semi-structured edge logs. Application lines arrived as JSON-ish payloads mixed into message. Without dissect/parse, log.level visualizations and error-focused alerts stay fragile. We iterated dissect tokenizers until a working pattern extracted log.level from the message body.
Fleet and agent topology. Elastic Agent and Fleet Server installs hit classic distributed-system friction: API client host timeouts (context deadline exceeded against Fleet on port 8220), proxy/host field mismatches, and a hard operational lesson documented in the engagement notes—Fleet Server needs to sit with Elasticsearch on the same server path or the enrollment/metrics path breaks. After correcting hosts and policy setup, curl against Fleet’s /api/status returned "status":"HEALTHY". Agent installs used Elastic Agent 8.7.0; indexed Filebeat traffic in the export sat on 8.5.3.
Retention without discipline. Shipping everything forever fights both cost and signal. Expectations explicitly asked for lifecycle policies. We encoded that as an ILM policy rather than a wish list.
Environment separation was not theoretical either. An exported Filebeat index sample (sensor_logs.csv) contained 5503 documents with production and staging already represented as fields—4779 production vs 724 staging in that export—plus component tags for server (4173), frame (724), and pumps (606). That is exactly the shape you want before you promise pump-level dashboards.
Solution
We treated the stack as a pipeline with contracts at each hop.
Ingest
Filebeat on the edge pushed logs toward Logstash. Logstash ran in Docker with a Beats input on port 5044, grok for timestamp and level where applicable, a date filter targeting @timestamp (timezone America/New_York in their compose notes), and Elasticsearch output with beat/version/date index naming. Operational hygiene included tailing Logstash container logs so failures did not silently drop data—matching their “track Logstash failures” requirement.
Model the domain
Index strategy followed the physical model: datasets per location, tags for server, frame, and pump. Meeting actions included parsing JSON fields (time, level, name, message), a bar chart on log.level, and multiple datasets for locations such as HQ and mini sites.
Parse for operators
Dissect configuration landed on a working tokenizer that pulls log.level from embedded JSON in message. That single field unlocks level histograms and “errors I care about” alerting without brittle ad-hoc Kibana scripts.
Lifecycle
ILM policy filebeat-general on the wasp/filebeat templates:
- Hot: rollover at max primary shard size 25gb or max age 30d
- Delete: after 365d
Index template wasp-logs bound filebeat-* patterns into a data-stream-capable template with that lifecycle name. That is the concrete answer to “limit the amount of data being stored.”
Fleet
Fleet Server was brought to HEALTHY; policies were created deliberately (including manual policy creation when needed); agents enrolled against the corrected Fleet URL/host configuration. Co-locating Fleet with Elasticsearch removed a class of dial/timeout failures that otherwise look like “Elastic is down” when the real issue is the control plane path.
Alerting design
Rules & Connectors pattern agreed in working sessions: check every 5 minutes; if no data is coming from a node, fire. That maps directly to the expectation “logs not being received from devices for a period of time.”
Dashboards (intent → structure)
With component and printer fields present, Kibana can answer “which pumps misbehave” and “what happened on this print” without exporting CSV from five machines. Security was scoped as learn-what-is-possible plus low-hanging fruit—not a full SOC build in one pass.
Sensitive install parameters (tokens, fingerprints, private IPs) stay out of published material. The pattern that matters publicly is: correct Fleet hosts, co-located Fleet/ES where required, verify HEALTHY, then confirm metrics actually arrive—not only that the agent process is running.
Results
Only what the evidence supports:
| Result | Evidence |
|---|---|
| Three WASP locations in scope for per-site datasets | Meeting notes |
| Production vs staging separation visible in indexed data | 4779 production / 724 staging in 5503-doc export |
| Component tagging live (server / frame / pumps) | 4173 / 724 / 606 in same export |
| ILM enforced retention envelope | 25gb or 30d rollover; delete at 365d |
| Fleet control plane healthy | Fleet /api/status → HEALTHY |
| No-data detection cadence defined | Alert check every 5 minutes |
| ELK compute baseline on AWS | ELK on m4.large, us-east-2 |
What we do not claim: invented latency percentages, storage cost savings percentages, or MTTR improvements. Those numbers were not in the source pack.
Company product context (coastal armoring material intensity vs traditional approaches) appears in internal Notion material with conflicting Natrx-side figures across screenshots; it is product storytelling, not an Elastic KPI, so it stays out of results.
Key Takeaways
- Model the machine. Server / frame / pump tags beat generic host fields when the question is “which pump is bad.”
- Put environments in the document. Production vs staging as fields made the expectation measurable (4779 / 724 in the export).
- Treat ILM as a product requirement. 25gb or 30d rollover, delete at 365d—exactly how they asked to limit stored data.
- Fleet HEALTHY ≠ metrics flowing. Co-locate Fleet with Elasticsearch when required; verify telemetry after enrollment.
- Alert on absence. A 5-minute “no data from this node” rule often beats another CPU chart on an edge fleet.
If your industrial or climate-tech hardware still depends on Docker tails and SSH, this is the Elastic pattern I implement: edge shippers, clear fields, lifecycle, Fleet done right, alerts on silence. For lifecycle mechanics see Elastic’s ILM documentation.
Ready to harden observability for your own fleet? → searchali.com